
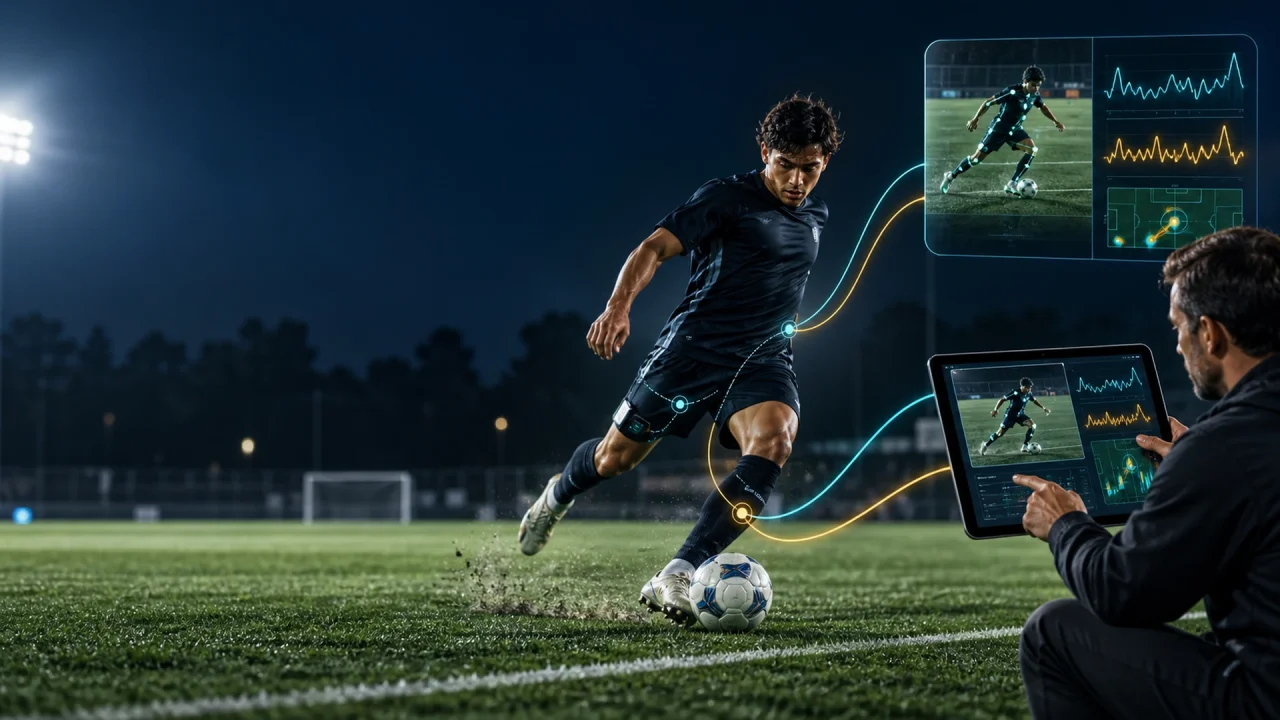
The next useful step in sports analytics is not a more sophisticated chart. It is the ability to look at a physical output and see the sporting moment that produced it. Coaches do not think in accelerations per minute. They think in the phase of play where a player kept arriving late, and until the data speaks that language it will keep being politely ignored.
Why a physical output without context misleads
A high-intensity distance figure tells you an athlete ran hard. It does not tell you whether they ran hard because the team lost shape, because they were covering for a teammate, or because they read the game early and were rewarded for it. Those three explanations imply three different training weeks, and the number is identical in all three.
The same applies in individual sport. A slower split can be pacing judgement, wind, tactical response to a rival, or fatigue. Treating it as one of those without checking is not analysis. It is guessing with a decimal point attached.
Linking event data, tracking, video and what the coach saw
Vendors have been converging on this for two years. Catapult describes Vector 8 as automatically connecting athlete monitoring data with its video suite, and its practitioner writing argues for starting from a performance question and linking physical signals to tactical reality rather than reporting them separately. Those are the supplier’s own accounts of the supplier’s own products, and they are worth reading as a description of where workflows are heading rather than as proof that any particular product improves results.
The underlying idea does not belong to any vendor. Four sources, aligned on a common clock: what happened in the sport, where players were, what the body did, and what the coach observed. Alignment is the whole trick. Once those four share a timeline, a number stops being an abstraction and becomes a clip.
Retrieval by coaching question, not by file location
Here is a small test of whether an analysis system is actually working. Ask it for every occasion this season when a full back was isolated one against one in the defensive third within ten seconds of a turnover.
If the answer requires someone to remember which match and scrub a timeline, the system is a filing cabinet. If the answer is a list of clips with the physical context attached, it is an analysis environment. The difference is not the quality of the video. It is whether the index was built around coaching questions or around dates.
From clips to a training priority
Evidence that stops at the clip has done half a job. The step that changes behaviour is turning a recurring pattern into a specific training design, with a named owner and a date to review whether it worked.
A worked sequence. The analyst notices a pattern of late arrivals into the box in the final 20 minutes. The physical data shows no decline in peak speed but a fall in repeated high-intensity efforts. The coach recognises it as a decision-making problem under fatigue rather than a conditioning ceiling. The intervention is a small-sided game with a fatigue protocol and a decision constraint, reviewed in three weeks against the same query. That is a complete loop: observe, understand, decide, deliver, learn.
Preserve the disagreement
The most valuable output of a joint review is often the moment the analyst, the sports scientist and the coach read the same clip differently. Systems tend to resolve that by picking a winner, usually whichever discipline owns the software. Do the opposite. Record the competing readings and the reason the decision went the way it did. Six weeks later, that record is the only thing that will tell you which reading was right, and it is the raw material of a programme that actually learns.
Where the evidence stops
Automated classification is wrong more often than its interfaces imply. Event detection mislabels, tracking loses players in congestion, and derived metrics inherit every error upstream of them. Three safeguards are not optional: keep the source video so a human can check, display a confidence indicator rather than a bare label, and let a practitioner correct a label without deleting the original output. A system that silently overwrites its own mistakes destroys the evidence you would need to know how often it makes them.
The question to take into your next performance meeting
Name one recurring tactical or technical question in your sport. How long would it take you today to produce every instance of it from this season, with the physical context attached?
Frequently asked questions
Why link GPS data to video?
Because a physical output on its own does not explain itself. The same high-intensity distance can result from good anticipation or from a structural problem, and those imply opposite responses. Linking the number to the moment lets coaches review evidence in the language of the sport rather than in units.
Can AI reliably tag match events automatically?
It can tag many events quickly and it does make mistakes, particularly in congested play and in less common event types. Automatic tagging is best treated as a first pass that saves time, with source video retained, confidence displayed, and a straightforward way for a practitioner to correct a label.
How should an analysis system be organised?
Around the questions coaches actually ask, rather than around matches and dates. If retrieving every instance of a recurring scenario requires someone to remember which fixture it happened in, the system is storing video rather than supporting analysis.
What should happen after a video review?
A named training intervention with a review date, and a record of why that intervention was chosen over the alternatives. Reviews that end at the insight stage rarely change anything, because nobody owns the next step.
Does integrating video and physical data improve results?
Vendors describe the integration; they generally stop short of claiming competitive improvement, and independent validation is limited. What integration reliably does is reduce the delay and the disagreement about basic facts, which is worth having on its own terms.
About this series
This is the fourth of seven articles on the movement from isolated measurement to connected, coach-led decision support in high-performance sport, following the Athleet AI cycle of observe, understand, decide, deliver and learn. It follows the athlete context graph and leads into how AI can scale individual attention across a squad.
Every club, athlete and scenario used as an illustration in this article is desensitised. Product capabilities are attributed to their vendors and should not be read as independently validated performance benefits. The material is presented to support discussion and further review.